Assignment & Notes
Check out the assignment and Notes from the Download Documents.
Please download the file for more Practice
AssignmentPlease download the slides for more Notes
Power Point SlidesOther Topics
Histogram
- Review: Frequency, Frequency Tables, and Levels of Measurement
- - Frequency and Frequency Tables Textbook
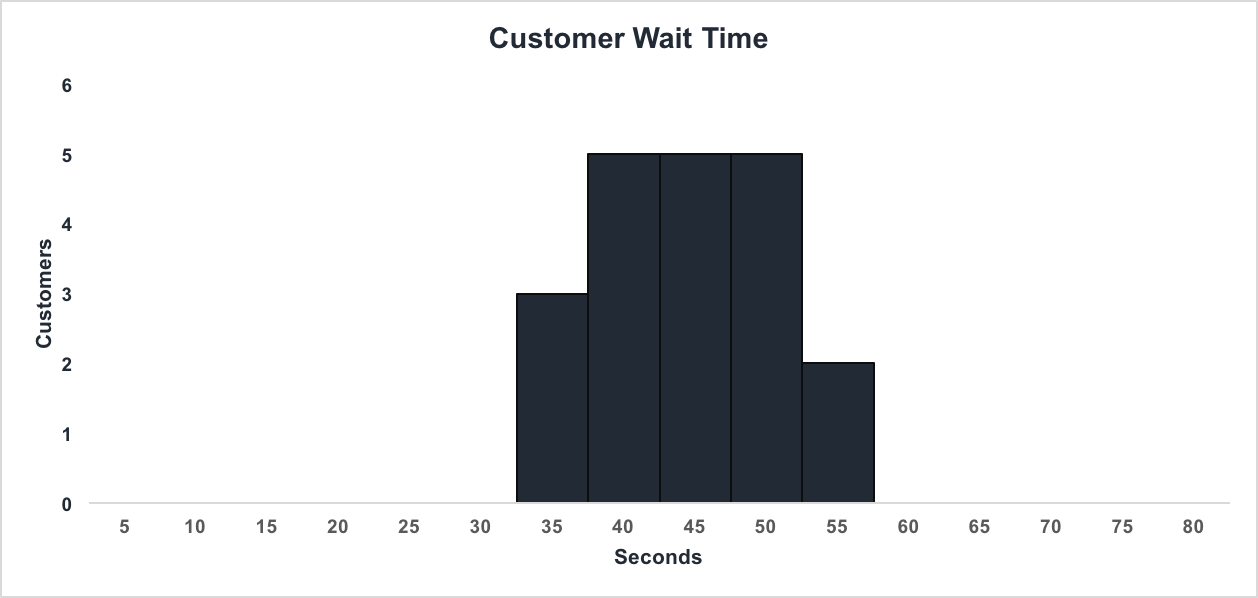
- Histogram A histogram consists of contiguous (adjoining) boxes. It has both a horizontal axis and a vertical axis. The horizontal axis is labeled with what the data represents (for instance, distance from your home to school). The vertical axis is labeled either frequency or relative frequency (or percent frequency or probability). The graph will have the same shape with either label. The histogram (like the stemplot) can give you the shape of the data, the center, and the spread of the data.
A histogram has the following properties:
a. The horizontal scale is quantitative and measures the data values
b. The vertical scale measures the frequencies of the classes
c. Consecutive bars must touch
Histogram is a plot of a set of continuous data(such as: Age and Income). Class Boundries are needed for a set of discrete data(such as: Number of Phone Calls)
Example of a Histogram:
Things you need to know in order to construct a histogram:
Range - the difference between the highest and lowest from the data values
# of Classes - the number of class intervals